
When business operations stall or project errors keep recurring, finding the true source of the problem can feel overwhelming. Standard brainstorming sessions often spin in circles, focusing on symptoms rather than root issues. That is where a fishbone diagram becomes an indispensable visual tool for teams worldwide. Also known as an Ishikawa diagram, this simple framework organizes potential causes into clear categories, helping you map out complex issues within minutes. By breaking down messy challenges into bite-sized visual branches, your team can fix operational headaches permanently instead of applying temporary band-aids.
How a Fishbone Diagram Uncovers Hidden Process Failures
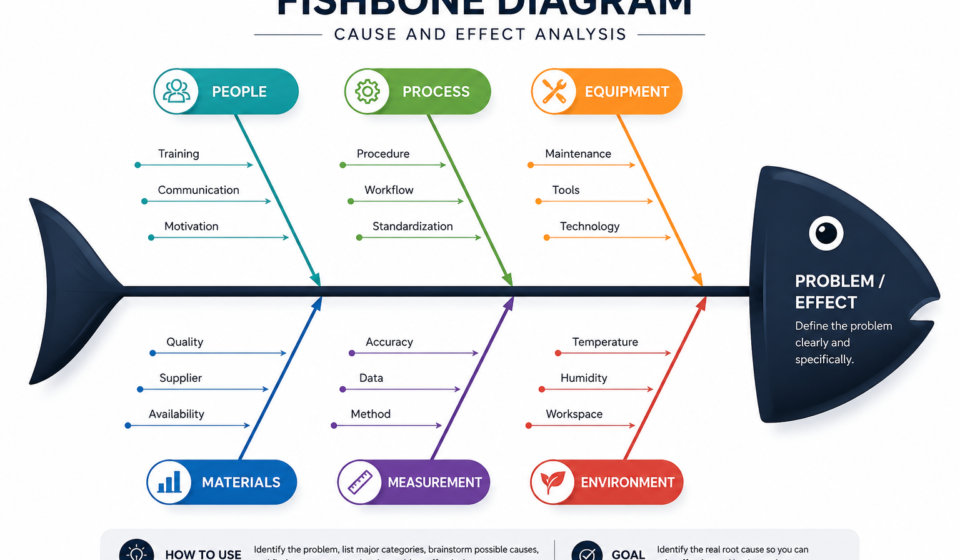
A fishbone diagram works by placing your main problem—the effect—at the head of the skeleton structure. A straight horizontal line acts as the backbone, leading directly to this central issue. From there, diagonal lines branch off to represent primary categories of potential causes.
These main branches typically cover key operational areas like people, processes, equipment, and materials. By visually separating these factors, team members avoid jumping to hasty conclusions or pointing fingers at individuals.
When you systematically examine each branch, secondary causes emerge naturally. For instance, if a delayed product delivery stems from “equipment failure,” a secondary branch might reveal a lack of routine maintenance schedules. This visual layout strips away confusion, making complex operational bottlenecks easy to analyze at a single glance.
Core Categories Used in Cause-and-Effect Analysis
To get the most out of your analysis, standard frameworks group potential causes into logical buckets. Depending on your industry, these categories adapt to match your daily workflow.
- Manufacturing (The 6 Ms): Manpower, Machine, Material, Method, Measurement, and Milieu (Environment).
- Service Industries (The 4 Ps): Policies, Procedures, People, and Plant/Technology.
- General Problem Solving (The 4 Ms): Mindpower, Machinery, Materials, and Methods.
Applying these categories ensures your team leaves no stone unturned during root-cause discussions.
Step-by-Step Guide to Running an Effective Session
To build a fishbone diagram that yields actionable results, gather a cross-functional team with diverse perspectives on the process.
First, clearly define the single problem statement at the far right of your whiteboard. Next, draw the central spine and add the main category branches relevant to your industry.
Now, begin brainstorming specific causes under each category. Ask the “5 Whys” for every point raised—asking “why did this happen?” repeatedly until you hit the base cause. Finally, review the completed diagram to identify which root causes carry the most impact and require immediate corrective action.
Framework Comparison: Finding the Right Tool
Choosing the right analytical method depends entirely on the complexity of your issue and the size of your team.
| Tool Name | Best Used For | Primary Benefit | Skill Level Required |
| Fishbone Diagram | Complex issues with multi-layered causes | Visual categorization of all potential variables | Beginner to Intermediate |
| 5 Whys Analysis | Simple, single-track operational errors | Quick identification of linear root causes | Beginner |
| Failure Mode Effects (FMEA) | High-risk industrial process planning | Quantitative risk scoring and prevention | Advanced |
| Pareto Analysis | Prioritizing high-frequency defect data | Focuses resources on the 80/20 rule | Intermediate |
Practical Takeaways and the Future of Process Improvement
Integrating a fishbone diagram into your regular problem-solving routine transforms how your organization approaches mistakes. Instead of reacting to sudden crises with guesswork, your staff gains a repeatable, evidence-based method for continuous improvement. Visual mapping removes emotion from tough discussions, focusing everyone’s energy on factual system breakdowns.
As digital collaboration tools evolve, AI-powered whiteboards now generate instant category suggestions based on real-time operational data. However, the fundamental strength of this classic technique remains unchanged: simple visual clarity. Mastering this diagram equips your team to eliminate recurring errors, streamline workflows, and drive sustained business success for years to come.
Frequently Asked Questions (FAQs)
What is the primary purpose of a fishbone diagram?
The primary purpose is to visually map out all potential causes of a specific problem, helping teams identify the true root cause rather than treating superficial symptoms.
When should I use a fishbone diagram instead of 5 Whys?
Use this visual tool when dealing with complex, multi-faceted problems that involve multiple departments, processes, or technologies. Use 5 Whys for simple, linear issues.
Who invented the fishbone diagram?
Dr. Kaoru Ishikawa invented the diagram in the 1960s to support quality management processes at Japanese industrial companies, which is why it carries his name.
Can remote teams build these diagrams effectively?
Yes, modern digital whiteboard platforms allow remote teams to build interactive visual diagrams together in real time, making virtual brainstorming seamless and productive.