
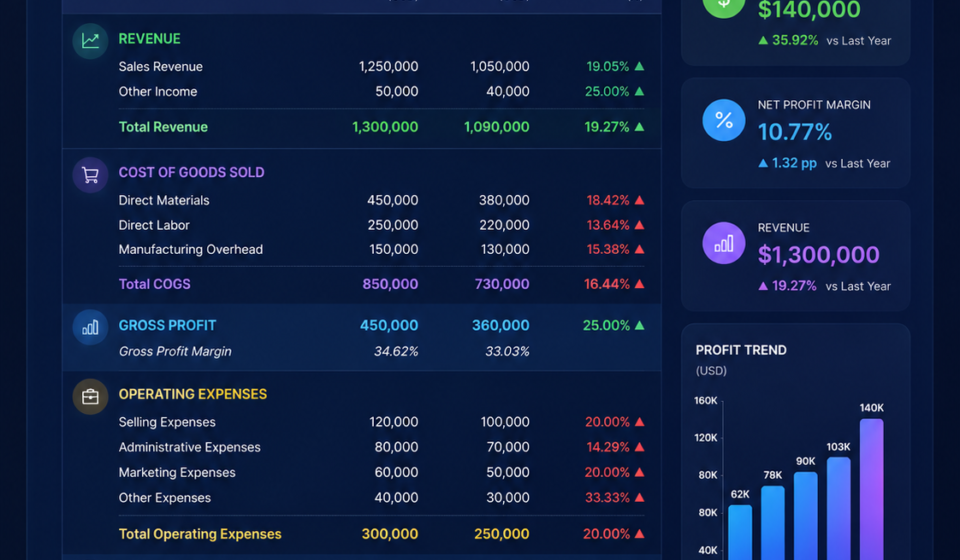

Every successful business owner knows that tracking cash flow is only half the battle. To understand whether your enterprise is truly building wealth or burning through capital, you must look deeper into your core financial performance. That is where a profit and loss statement becomes your ultimate financial compass. Often called an income statement, this essential document breaks down your revenues, costs, and expenditures over a specific period. By turning raw sales figures into clear actionable insights, this financial summary helps you identify hidden expenses, increase margins, and make confident business decisions that fuel lasting growth.
Understanding the Anatomy of Financial Performance
A profit and loss statement measures your business activity across a defined window of time, such as a month, quarter, or fiscal year. Unlike a balance sheet that takes a single snapshot of assets and liabilities, this document tells the full story of your ongoing operations.
The structure begins with your top-line revenue, representing total sales generated before subtracting any expenses. From there, cost of goods sold is deducted to reveal your gross profit.
Next, operational costs like rent, marketing, utilities, and payroll are subtracted to show your operating income. Finally, after factoring in taxes and interest, you arrive at the bottom line: your net income. This step-by-step layout reveals exactly where your money enters, where it exits, and how much stays in your pocket.
Key Components and Financial Metrics Breakdown
Reading your financial report becomes effortless once you understand its primary structural blocks. Grouping your line items into clear categories helps you pinpoint financial strengths and weaknesses immediately.
- Total Revenue (Sales): The gross amount of money earned from selling products or providing services before any deductions.
- Cost of Goods Sold (COGS): Direct costs tied directly to creating products, including raw materials and direct production labor.
- Operating Expenses (OPEX): Indirect costs required to run daily operations, including advertising, office rent, insurance, and administrative salaries.
- Gross and Net Margins: Percentages showing how much profit remains from every dollar earned after paying direct and total expenses.
Proactive Tips for Improving Your Net Margins
Regularly reviewing your financial reports allows you to spot negative trends early. Compare your monthly statements side by side to identify sudden spikes in operating expenses.
Work to renegotiate vendor contracts, eliminate unused software subscriptions, and focus sales efforts on high-margin services. Small adjustments across multiple expense categories accumulate rapidly, delivering a massive boost to your bottom line by year’s end.
Financial Statements Comparison: Knowing the Difference
Different financial reports serve unique roles in evaluating the health and stability of your business organization.
| Financial Report | Core Focus | Primary Timeframe | Main Purpose |
| Profit and Loss Statement | Revenue, costs, and net profitability | Over a specific period (Month/Year) | Measures operational profitability and margins |
| Balance Sheet | Assets, liabilities, and owner equity | At a specific point in time (Single Date) | Shows net worth and financial stability |
| Cash Flow Statement | Inflows and outflows of actual cash | Over a specific period (Month/Year) | Tracks liquidity and cash availability |
| Budget vs. Actual Report | Variance between planned and real spending | Ongoing operational period | Keeps departmental spending on target |
Practical Takeaways and Smart Financial Planning
Mastering a profit and loss statement gives you complete control over the financial trajectory of your business. Rather than guessing whether your operations are profitable, consistent reporting offers clear factual evidence to guide your hiring, inventory, and marketing investments.
Modern accounting tools now automate these reports, integrating bank feeds to give you real-time visibility into your earnings. By reviewing these numbers regularly, you can pivot quickly, eliminate waste, and build a scalable business designed for long-term commercial success.
Frequently Asked Questions (FAQs)
What is the main purpose of a profit and loss statement?
The main purpose is to show a company’s total revenue, expenses, and net profit or loss over a specific period to evaluate operational efficiency.
How often should a small business review this statement?
Small business owners should generate and review this financial summary monthly to track spending trends, manage cash flow, and adjust operational budgets quickly.
What is the difference between gross profit and net profit?
Gross profit is revenue minus direct production costs (COGS), while net profit is the final amount remaining after deducting all operational expenses, interest, and taxes.
Can a company show a profit on this statement but still run out of cash?
Yes, because this statement records revenue when earned and expenses when incurred, while actual cash payments and collections may happen on different dates.